
District selection for each business function
Put revenue sites where customers are and support sites where rent and access are favorable.
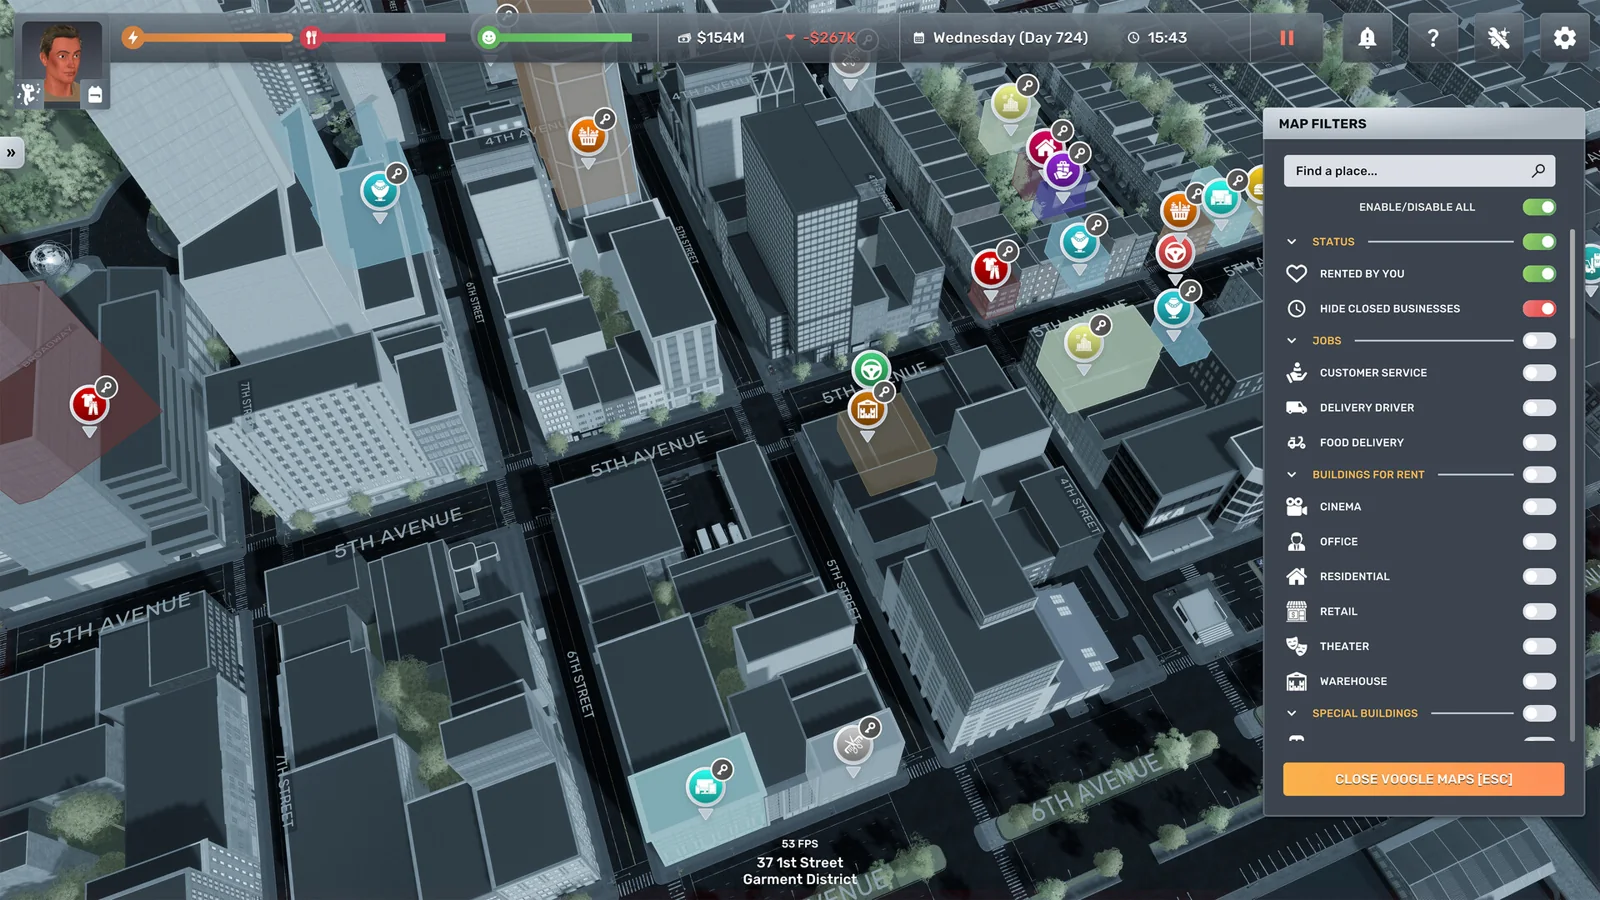
Decision first
Use current demand to choose the district, then use Traffic Index, capacity, rent and layout to choose the address.
In Big Ambitions 1.0/build 3674, a neighborhood is not ‘best’ in isolation. It is a bundle of demand, providers, population, traffic, premises, costs, staffing, logistics, security, and opening-hour fit.
Confirm 1.0/build 3674.
Complete operating playbook
- ARTICLE LENGTH
- 5,172 words
- DEEP-DIVE SECTIONS
- 16
- RESEARCH LEDGER
- 8
District selection is a portfolio decision
In Big Ambitions 1.0/build 3674, a neighborhood is not ‘best’ in isolation. It is a bundle of demand, providers, population, traffic, premises, costs, staffing, logistics, security, and opening-hour fit.
Official 1.0 adds The Hamptons as the seventh neighborhood. Any guide that assumes a permanent six-district map or ranks districts without the new area is stale for this baseline.
Build 3674 fixes MarketInsider opening to the neighborhood the player is currently in. Always read the neighborhood label anyway; a correct screen is useful only when the researcher records which place it describes.
Developer explanations establish that MarketInsider demand responds to the number of providers. Opening another business, including another player-owned branch, can lower the displayed opportunity. A pre-lease snapshot can therefore become obsolete after entry.
Traffic index controls potential exposure and reduces the marketing needed to reach the promotion ceiling. It matters to retail and, according to a current developer reply, still matters to office businesses whose customers are served digitally.
Population groups affect price acceptance and product fit. Developer guidance distinguishes working-, middle-, and upper-income residents; it describes greater above-market tolerance among middle and upper groups and a working-class focus for Garment District.
Reject universal profit claims. A famous high-demand district can lose money when rent, capacity, wages, security, supply, or competition are wrong, while a modest site can excel with low overhead and a matched concept.
Action checklist
- Confirm 1.0/build 3674.
- Include all seven current neighborhoods.
- Record MarketInsider’s displayed neighborhood.
- Treat demand as provider-sensitive.
- Evaluate economics, not reputation.
| Selection factor | Evidence | Decision use |
|---|---|---|
| Dimension | Supported effect | Do not infer |
| Demand | Provider-sensitive market opportunity | Guaranteed customers |
| Traffic | Potential exposure and marketing leverage | Automatic full capacity |
| Population | Price/product acceptance context | Fixed optimal markup |
| Premises | Capacity and cost ceiling | Demand itself |
| Neighborhood count | Seven in 1.0 | Old six-area rankings remain complete |
Create a candidate-location worksheet
Compare addresses on one worksheet before signing a lease. Memory overweights a cheap rent or an exciting demand percentage.
For each candidate record neighborhood, address, shell code, business type allowed, customer capacity, traffic index, rent, deposit, installation estimate, distance to home, wholesale, warehouse, recruiting, and intended opening hours.
Add MarketInsider fields: demand, provider count, existing competitors, your own providers, and population mix. Take all readings on the same game day where possible so a market change does not contaminate the comparison.
Add operational fields: delivery spot, storage potential, entrance geometry, security burden, employee pool and commute implications, nearby parking or loading convenience, and whether the player expects frequent manual visits.
Add economic assumptions: target customers per hour, average contribution per customer, required staff, marketing, security, cleaning, logistics, inventory investment, and financing cost. Mark each as measured, live UI, or estimate.
Use screenshots for spatial facts and text values for formulas. Name each candidate with neighborhood, address, shell, build, and date. Do not delete rejected candidates; they become useful comparables after rent or demand changes.
Set a decision deadline and cash reserve. A lease that consumes the buffer needed for stock, payroll, marketing, and fit-out is not affordable merely because the deposit can be paid.
Action checklist
- Record every candidate on the same fields.
- Take market readings on one game day.
- Include logistics and security facts.
- Label measured values versus estimates.
- Protect post-opening cash reserve.
| Selection factor | Evidence | Decision use |
|---|---|---|
| Worksheet block | Fields | Use |
| Site | District, address, shell, capacity, traffic | Physical fit |
| Market | Demand, providers, population | Opportunity |
| Cost | Rent, fit-out, stock, wages, marketing | Feasibility |
| Operations | Delivery, storage, security, travel | Execution |
| Evidence | Build, date, source, confidence | Audit |
Read demand and providers together
A demand percentage without provider context is incomplete. It is a market signal, not a forecast equation.
Developer David explains that MarketInsider demand changes as providers enter and that one added seller can cause a visible drop. Record both demand and provider count before and after the player opens.
Different product and business types tolerate competition differently. The developer explicitly warns that a low demand percentage does not universally mean no sales. Avoid a rule such as ‘never enter below X percent.’
Separate the business category from individual products where the UI does. A neighborhood may support one item strongly and another weakly. A mixed store needs a product-level assortment plan rather than one average demand number.
Your own businesses are providers too. Model cannibalization before placing multiple branches in the same neighborhood. The second store may add reach or capacity, but it can also split opportunity and duplicate rent and payroll.
Create a market-entry delta: post-entry demand minus pre-entry demand, post-entry combined customers minus prior customers, and post-entry combined contribution minus prior contribution. The last measure decides whether a second branch created value.
Recheck after competitors change. A location decision is versioned to a market date; MarketInsider is not a permanent census.
Action checklist
- Record demand with provider count.
- Avoid hard demand cutoffs.
- Inspect product-level demand where available.
- Model own-store cannibalization.
- Measure combined contribution after entry.
| Selection factor | Evidence | Decision use |
|---|---|---|
| Market state | Interpretation | Test |
| High demand, few providers | Promising unfilled opportunity | Small validated launch |
| High demand, many providers | Category may be large but contested | Price and capacity pilot |
| Low demand, few providers | Could be small market or poor fit | Low-cost experiment |
| Demand falls after own entry | Expected provider response | Compare combined contribution |
Traffic index and marketing substitution
Traffic index creates potential customers and reduces how much paid promotion is needed to reach the promotion ceiling.
A developer-provided approximation is promotion effect = min(100, traffic index plus marketing score divided by two). Use the live UI to confirm current values, but this formula gives a testable way to compare sites.
Required marketing score to reach 100 under that model is max(0, two times (100 minus traffic index)). A site with traffic 60 would need marketing score 80; a site with traffic 48 would need 104 and therefore may not be able to reach the same ceiling if marketing is capped at 100.
Traffic is not the same as realized customers. Demand, providers, opening hours, price satisfaction, capacity, inventory, and staffing still constrain sales. Use traffic to model exposure and marketing cost, not daily revenue directly.
Developer guidance says a 75-cap premises with very low traffic should not be expected to match an otherwise similar higher-traffic site merely because the lease capacity is the same. Capacity is the ceiling after market flow arrives.
Calculate annualized or weekly location premium against marketing savings and added contribution. Paying more rent for traffic is justified when incremental gross contribution plus saved marketing exceeds rent, staffing, security, and logistics differences.
For office businesses, do not dismiss traffic because clients appear digitally. A December 2025 developer reply confirms traffic index still matters. Include it in the office site worksheet.
Action checklist
- Record live traffic index.
- Compute marketing needed under the developer model.
- Do not convert traffic directly to customers.
- Compare traffic premium with marketing and contribution.
- Apply traffic analysis to offices too.
| Selection factor | Evidence | Decision use |
|---|---|---|
| Traffic use | Formula/evidence | Decision |
| Promotion estimate | min(100, TI + M/2) | Compare marketing plans |
| Marketing need | max(0, 2*(100-TI)) | Estimate ceiling reach |
| Customer forecast | Not TI times capacity | Run observed test |
| Rent premium | Added contribution plus saved marketing minus added costs | Choose site |
Population mix and price acceptance
Neighborhood demographics shape which concepts and prices deserve testing, but they do not create a fixed district markup.
Developer Jonas identifies working-, middle-, and upper-income groups and says middle and upper groups tend to accept above-market prices more readily. Use this to prioritize hypotheses, then validate satisfaction and contribution.
The same reply identifies Garment District as mainly working class. That is a stable qualitative clue, not a license to label every customer or prescribe permanent low prices.
Match products and service price bands to the population mix shown by current market screens or F1. A high-value category in an affluent area may tolerate more margin, but provider count and demand can still make the opportunity weak.
Record current price, landed cost, units, satisfaction, and contribution by neighborhood. Compare a controlled price ladder rather than copying another player’s markup. The Pricing Manager’s neighborhood suggestions are another hypothesis source.
A lower-price high-volume plan needs stock, checkout, and logistics capacity. A higher-price plan needs enough retained demand. District fit and operations must be solved together.
Do not use demographic labels as moral or aesthetic rankings. They are model variables for product and price behavior. The best district is the one where the tested operating design creates robust contribution.
Action checklist
- Record current population context.
- Use demographics to prioritize tests.
- Run local price ladders.
- Check supply and throughput for volume strategies.
- Judge contribution, not district prestige.
| Selection factor | Evidence | Decision use |
|---|---|---|
| Population context | Likely test emphasis | Required validation |
| Working | Value and volume hypotheses | Margin, stock, capacity |
| Middle | Moderate above-reference tests | Retention and satisfaction |
| Upper | Premium hypotheses | Demand and provider depth |
| Mixed/uncertain | Wider controlled ladder | Segmented evidence |
Premises capacity and shell geometry
A district can be attractive while the available premises is wrong. Evaluate the exact address, not the neighborhood average.
Record the building’s customer-per-hour capacity and shell code. Then calculate required product, checkout, service, seating, or production capacity for the intended target. The smallest relevant stage controls operational throughput.
Inspect entrance, doors, delivery spot, storage potential, bathroom, columns, and usable floor. A cheap high-cap shell can require an expensive layout or create poor player-present flow.
Set target capacity from evidence, not from lease maximum. If demand and traffic support only twenty customers, hiring and furnishing for seventy-five destroys the site economics. Design modular expansion space.
Estimate fit-out cost by required objects, security, employee demands, and installation. Include stock needed to fill combined displays and reserve storage. The deposit is a small part of launch capital.
Compare relocation threshold: expected incremental contribution at the larger site must exceed extra rent, installation amortization, downtime, inventory, payroll, security, and logistics. Write every term.
Keep shell compatibility in the record when using blueprints. A district decision that assumes an incompatible Workshop layout is not costed.
Action checklist
- Record exact premises capacity and code.
- Walk geometry and delivery route.
- Choose an evidence-based target.
- Cost full fit-out and opening stock.
- Model relocation as an incremental package.
| Selection factor | Evidence | Decision use |
|---|---|---|
| Site factor | Measure | Economic effect |
| Building cap | Customers per hour | Upper bound |
| Shell geometry | Usable paths and storage | Fit-out and flow |
| Target T | Observed market-supported throughput | Fixture and staff count |
| Fit-out | Furniture, security, stock, installation | Launch cash |
| Relocation delta | All added costs versus contribution | Go/no-go |
Rent, deposit, and liquidity
The correct neighborhood must survive the ramp period. Protect enough cash to learn rather than optimizing the lease in isolation.
Calculate launch cash = deposit plus first rent exposure plus licenses plus fit-out plus opening inventory plus vehicle or logistics setup plus recruitment and training plus marketing plus payroll reserve plus contingency.
Use conservative revenue during ramp. New prices, employee skill, promotion, and stock policy need time to stabilize. Do not fund the site assuming immediate customer capacity.
Calculate weekly break-even customers = weekly fixed and semi-fixed costs divided by expected contribution per customer, then divide by valid open hours for an hourly requirement. Use a range for contribution when basket mix is uncertain.
Compare required hourly customers with traffic, demand, provider context, and target capacity. If break-even nearly equals the premises cap, the plan has little tolerance for random variation or support costs.
Include headquarters allocation, insurance, security, cleaning, warehouse, delivery, interest, and owner travel where relevant. Omitting shared costs makes an expensive district look safer than it is.
Set abandonment and redesign triggers before signing: maximum loss weeks, minimum cash reserve, repeated customer shortfall, or fit-out overrun. A precommitted rule prevents sunk-cost escalation.
Action checklist
- Calculate complete launch cash.
- Use conservative ramp revenue.
- Compute weekly and hourly break-even customers.
- Include shared and financing costs.
- Define cash and performance stop rules.
| Selection factor | Evidence | Decision use |
|---|---|---|
| Cash term | Include | Control |
| One-time | Deposit, license, fit-out, stock | Launch budget |
| Weekly fixed | Rent, salaries, HQ allocation, interest | Break-even |
| Variable | COGS, volume-related delivery | Contribution |
| Reserve | Payroll, replenishment, contingency | Survival |
| Stop rule | Loss weeks or cash floor | Exit discipline |
Staffing and commute feasibility
A market opportunity fails if the schedule cannot be staffed at acceptable cost and satisfaction.
List every required role, skill, full-time or part-time pattern, opening-hour coverage, wage, employee demands, insurance, and training. Build the weekly schedule before finalizing the lease.
Location affects player travel and may affect the practicality of recruitment and management even where the game does not expose a formal commute penalty. Treat travel convenience as operational time, not an invented customer bonus.
Cost peak staffing and weak boundary hours separately. A site with strong weekend or night demand may require additional employee groups and security. Compare actual shift packages.
For office businesses, start with staffed seats below premises maximum and expand from observed utilization. For retail, ensure checkout and each required product category match target. For food or entertainment, include the complete production/service chain.
Check employee-demand furniture against the shell. A supposedly efficient small office can become invalid when several specialists request items that require floor or wall space.
Add vacancy risk. If one employee absence closes a critical station, budget cross-training, spare staff, or a narrower schedule. Headquarters automation can reduce risk but adds overhead.
Action checklist
- Draft the full weekly roster.
- Cost day and night packages separately.
- Match staff to operational bottlenecks.
- Reserve space for employee demands.
- Price vacancy coverage.
| Selection factor | Evidence | Decision use |
|---|---|---|
| Staff issue | Site question | Mitigation |
| Peak demand | Can required roles cover it? | Stagger shifts |
| Boundary hour | Does full crew still pay? | Shorten schedule |
| Specialist seats | Will utilization cover wages? | Start small |
| Vacancy | Does one absence stop trade? | Cross-train or spare |
Logistics and inventory reach
District selection includes the cost and reliability of getting products to the exact premises.
Map supplier or factory to warehouse to store, including import times, Logistics Manager, vehicle, destination count, delivery priority, target units, destination shelf space, and emergency wholesale route.
Calculate store target = max(combined display capacity, forecast demand to next replenishment plus safety). Convert units to boxes for storage and vehicle planning using current box sizes.
A distant or awkward site may still work under automated logistics, but manual startup and emergency restocking consume player time. Assign a value or at least a risk rating to that burden.
Check whether adding the store exceeds manager or vehicle destination limits. The incremental site may require another manager, vehicle, route, or warehouse expansion. Charge the full step cost to the decision.
Account for timing: a store’s peak can occur before the next route or before Monday import stock becomes available. Size safety to the actual sequence.
Record delivery spot and back-room geometry during the walkthrough. A high-traffic address with inadequate destination storage can lose its apparent advantage through chronic stockouts.
Action checklist
- Map the complete supply path.
- Calculate unit target and box space.
- Include manual rescue time.
- Check destination-limit step costs.
- Match safety to event timing.
| Selection factor | Evidence | Decision use |
|---|---|---|
| Logistics factor | Measure | Site penalty |
| Distance/manual route | Travel time and loading | Owner labor |
| Automation scope | Manager/vehicle destinations | Step overhead |
| Storage | Rounded boxes that fit | Stockout risk |
| Timing | Peak versus delivery/import | Safety requirement |
| Delivery geometry | Spot-to-shelf route | Handling friction |
Security and loss exposure
High-value product opportunities carry protection costs that vary with store size, hours, and layout.
Identify whether the business requires panels, cameras, guard support, and simultaneous guards under current F1. Older developer guidance says valuable stores such as jewelry, electronics, and clothing need stronger protection; exact current requirements must be read live.
Cost guards for every open hour, not a daily average. A district whose demand extends late may require a second shift or expensive schedule pattern. Add equipment and guard-locker space to fit-out.
Read theft in each store’s EconoView after opening. Net security value = avoided theft versus a comparable baseline minus incremental guards and equipment. Keep uncertain missed-sale contribution separate.
Traffic and customer volume do not directly establish theft. Measure the specific store. A premium district is not automatically safer or more dangerous unless current game data proves it.
Camera sight lines and entrance detector geometry can disqualify a shell. Reserve coverage before decorative layout. If installer-placed cameras do not register, current developer troubleshooting suggests removing and replacing them, then reproducing.
A site is unsuitable when required protection plus staffing eliminates the contribution of its demand window and no layout or schedule redesign fixes it.
Action checklist
- Read live security requirements.
- Cost every protected opening hour.
- Track store-specific EconoView theft.
- Validate camera and detector geometry.
- Include security in site break-even.
| Selection factor | Evidence | Decision use |
|---|---|---|
| Security cost | Pre-lease evidence | Post-open evidence |
| Equipment | Required devices and coverage plan | Recognized security score |
| Guards | Simultaneous count and hours | Schedules and wages |
| Theft | Risk estimate only | Store EconoView |
| Net value | Projected cost | Avoided loss minus cost |
Opening-hour fit
A district’s value depends on when its customers arrive and what it costs to serve those hours.
Use a broad initial schedule and BizMan Insights’ Yesterday customer graph to map customers by weekday and hour. Developer replies say business types differ across weekdays, weekends, mornings, evenings, and night.
Calculate hourly contribution = revenue minus COGS minus direct wages minus incremental cleaning and security. A high-demand hour that requires a full late crew can be weaker than a moderate daytime hour.
Compare candidate districts on matched hours. One site may have better lunch exposure while another supports evenings. Total weekly customers can hide a schedule that is impossible for the intended roster.
Office traffic matters even with digital customers, so test office hours against both traffic index and realized clients. Do not fill every desk for every open hour.
Nightlife and other time-shaped concepts need day-specific schedules. Cost midnight-crossing security and cleaning before calling a district suitable.
After changing price, promotion, capacity, or competitor state, rerun the hourly baseline. Site fit is partly a time profile and can change.
Action checklist
- Collect a full weekday-hour curve.
- Calculate contribution by boundary hour.
- Compare sites on matched operating windows.
- Size office staff to utilization.
- Retest after material market changes.
| Selection factor | Evidence | Decision use |
|---|---|---|
| Time measure | Record | Decision |
| Customers/hour | Yesterday graph by weekday | Candidate schedule |
| Contribution/hour | Revenue minus variable and incremental costs | Keep/trim |
| Crew package | Required roles by hour | Labor feasibility |
| Support hours | Security and cleaning | True boundary cost |
| Change event | Price, rival, capacity, patch | Rebaseline |
Weighted scoring without fake precision
A scorecard is useful for discipline, but weights must represent the player’s strategy and hard failures must remain vetoes.
Normalize candidate factors to a common scale: demand opportunity, traffic, population fit, capacity fit, rent, fit-out, logistics, staffing, security, travel, and expansion flexibility. Document how each score was calculated.
Choose weights before seeing the final total. A cash-constrained startup may weight launch cost and liquidity heavily; a mature chain may weight capacity, automation, and cannibalization. No weight set is universal.
Use score = sum(weight_i times normalized factor_i), with weights summing to one. Run sensitivity analysis by changing the largest uncertain weight or input. If the winner flips easily, gather more evidence or pilot.
Keep hard gates outside the score: unaffordable launch cash, impossible required layout, no valid supply plan, or break-even near an unreachable capacity. A high weighted average must not compensate for mechanical impossibility.
Add uncertainty ranges. Demand and expected contribution deserve wider ranges than live rent or premises capacity. Prefer the candidate that remains viable under conservative assumptions, not only the highest point estimate.
Store the raw worksheet with the score. A final number without source values creates false authority and cannot be updated after build or market changes.
Action checklist
- Normalize and document factors.
- Choose strategy-specific weights first.
- Run sensitivity analysis.
- Apply hard feasibility gates.
- Keep ranges and raw inputs.
| Selection factor | Evidence | Decision use |
|---|---|---|
| Factor | Possible direction | Confidence |
| Demand/providers | More unmet opportunity is favorable | Medium; market changes |
| Traffic/marketing | More exposure lowers promotion need | High for live values |
| Rent/fit-out | Lower cost protects break-even | High |
| Contribution forecast | Higher is favorable | Low until pilot |
| Logistics/security | Lower burden is favorable | Medium |
Pilot before full build-out
When uncertainty is high, buy information with the smallest operationally complete launch rather than a maximum-capacity fit-out.
Choose a premises and install all mandatory requirements for a modest target T. Do not omit a required product, service stage, bathroom, cleaning, or security merely to make the pilot cheap; an incomplete shop produces invalid evidence.
Open with stable prices, promotion, stock, and staffing for a full week. Record hourly customers, units, contribution, satisfaction, queues, stockouts, theft, and employee faults.
Compare observed customers with the conservative, base, and optimistic site cases. Update demand assumptions, marketing effect, required crew, inventory velocity, and break-even.
Expand one constrained stage only after repeated saturation. Add a fixture set, lane, service seat, storage bay, or schedule block, then rerun matched days.
Define a pilot exit: if contribution remains below the stated threshold after valid operation and one justified correction, close or relocate before installing prestige furniture and oversized stock.
Treat the pilot as district evidence only for that business and market date. Do not declare the neighborhood universally good or bad.
Action checklist
- Launch a complete modest target.
- Freeze controls for one full week.
- Compare with scenario forecasts.
- Expand the exact saturated stage.
- Use a prewritten exit rule.
| Selection factor | Evidence | Decision use |
|---|---|---|
| Pilot phase | Evidence | Gate |
| Setup | All current requirements valid | Open |
| Baseline | Seven valid days | Diagnose |
| Correction | One justified change | Retest |
| Expansion | Repeated saturation and contribution | Add one stage |
| Exit | Persistent failure under valid operation | Close/relocate |
Cannibalization and chain placement
A new branch should increase combined portfolio contribution, not merely transfer customers from an existing store.
Before entry, record each existing same-category business’s customers, units, contribution, demand, providers, capacity, and stock. Add the candidate’s forecast and expected new overhead.
After opening, record the same metrics for the combined portfolio. Cannibalization ratio can be estimated as lost units at existing branches divided by units at the new branch, but contribution change is the decisive measure.
A second branch can still be valuable when it adds capacity, hours, convenience, or a distinct population segment. State the hypothesized benefit before opening and test it.
Provider-sensitive demand means your own entry can change MarketInsider. Snapshot before signing and immediately after activation, then again after stabilization.
Compare same-neighborhood expansion with entering another neighborhood. The Pricing Manager and logistics structure may make concentration cheaper, while diversification may reduce self-competition. Price the management and route steps.
Do not close an older store solely because its individual sales fell. Evaluate combined contribution, shared overhead, and whether relocating or differentiating assortment produces a better portfolio.
Action checklist
- Baseline every existing branch.
- Measure post-entry portfolio contribution.
- Write the branch’s distinct purpose.
- Capture demand before and after activation.
- Compare concentration with cross-district entry.
| Selection factor | Evidence | Decision use |
|---|---|---|
| Measure | Formula/use | Interpretation |
| Cannibalized units | Old-branch loss divided by new-branch units | Transfer indicator |
| Combined contribution | All branches after minus before | Value creation |
| Demand delta | Post-entry minus pre-entry | Provider response |
| Step overhead | New manager, vehicle, marketing, security | True branch cost |
Troubleshooting decision tree
When a location misses forecast, test operation before rejecting the district and market before rebuilding the store.
First confirm the business is complete: open hours, required furniture, valid staffed stations, inventory, checkout or service, cleaning, security, and access. Repair any fault and discard the contaminated day.
Second identify capacity or supply constraints. If customers hit a known limit, expand the smallest justified stage. If products stock out, repair targets, source, storage, and timing before measuring demand.
Third verify the current neighborhood in MarketInsider, demand, providers, traffic, promotion, price satisfaction, and recent competitor or own-store changes. Build 3674 fixes a screen-selection bug but not stale notes.
Fourth recalculate break-even with actual contribution per customer and actual crew. If required customers exceed the valid market-supported range, resize, reschedule, reprice, or exit.
Fifth compare the candidate thesis: population fit, hours, logistics, security, and cannibalization. One failed assumption may be repairable; several independent failures indicate a poor site.
If mechanics contradict F1 after a clean build-3674 reproduction, capture the save, address, screens, schedule, and results and report with F2.
Action checklist
- Operation complete? Repair first.
- Capacity or stock constrained? Correct.
- Market screen and competitors current? Rebaseline.
- Actual break-even viable? Redesign or exit.
- Persistent contradiction? Reproduce and report.
| Selection factor | Evidence | Decision use |
|---|---|---|
| Node | If yes | If no |
| Complete operation? | Check constraints | Repair and rerun |
| Capacity/supply constrained? | Fix exact bottleneck | Check market |
| Market thesis intact? | Recalculate economics | Rebaseline |
| Break-even reachable? | Run controlled correction | Resize or exit |
| Result reproducible? | Document decision | Extend sample |
Final district audit
The lease decision is ready only when market, premises, operations, finance, and evidence all pass together.
Confirm all seven current neighborhoods were considered where relevant, MarketInsider snapshots show the correct labels, and demand/provider data is dated. Include The Hamptons rather than inheriting a six-neighborhood comparison.
Confirm the exact premises supports every live F1 requirement, target capacity, delivery route, storage plan, security geometry, employee-demand space, and player-present circulation.
Confirm launch cash includes deposit, license, fit-out, inventory, recruitment, training, marketing, payroll reserve, logistics, security, insurance, headquarters allocation, financing, and contingency.
Confirm break-even customers are below a conservative operational target with buffer. Validate traffic and marketing using the developer relationship only as a current testable model, then observe actual customers.
Confirm staffing, opening hours, inventory timing, route limits, and protection are feasible. For additional branches, confirm combined contribution after cannibalization and step overhead.
Archive the worksheet, weights, ranges, pilot result, rejected alternatives, build 3674, and review triggers. Reopen the decision after a major patch, competitor entry, own expansion, cost shift, recurring stockout, or sustained traffic and demand change.
Run a downside case before commitment. Reduce expected customers, contribution per customer, and marketing effectiveness to the conservative ends of their ranges while increasing wages, security, inventory, and fit-out to their plausible high cases. Calculate weekly burn and cash runway. A candidate that wins only under the optimistic case is speculation; label it accordingly and require a smaller pilot or larger reserve.
Run a capacity-consistency check. The conservative, base, and optimistic customer forecasts must each fit beneath the smallest of premises, required-item, staffed, checkout, service, seating, or production capacity. If a forecast exceeds a limit, either cost the exact expansion package or cap the forecast. This prevents a scorecard from crediting sales the proposed layout cannot serve.
Run a timing-consistency check. Place opening hours, peak customers, staff shifts, guard shifts, import receipts, logistics deliveries, and cash payments on one weekly timeline. Confirm stock arrives before demand, protection covers every trading minute, and payroll or rent does not fall before expected receipts. Weekly totals can balance while the sequence still fails.
Document the losing finalist as carefully as the winner. Keep its rent, traffic, demand, provider count, shell, break-even, and rejection reason. If the chosen site later fails because the market changed, the alternative can be refreshed without restarting research. A district choice is a reversible portfolio allocation, not a declaration that one neighborhood is permanently superior.
Add a financing sensitivity pass. Recalculate the site with the actual loan payment or opportunity cost of cash, then delay expected stabilization by one and two weeks. Measure the lowest cash balance in each case. A project can show positive steady-state profit and still fail before it reaches that state. Reject or resize any candidate whose conservative cash path crosses the protected payroll and inventory reserve.
Add a travel-and-intervention log during the pilot. Count emergency wholesale trips, manual deliveries, employee replacements, security fixes, and layout visits, with the game time consumed. Automation may remove these costs later, but the startup site must survive before that system exists. Compare candidates on the operational burden actually observed rather than assigning a vague convenience score.
At the review date, separate site failure from concept failure. If traffic and market opportunity were close to forecast but contribution was weak, inspect price, wages, product cost, and security. If operation was efficient but customers remained below the conservative case, revisit demand, providers, and location. If both failed, exit. This classification determines whether the next move should reuse the business model elsewhere or replace the concept entirely. Sign the decision with the test date, remaining cash, and the next observable condition that would justify reopening the rejected alternative. Record who made the decision, which forecast case governed it, and whether any unresolved evidence could materially reverse the choice.
Action checklist
- All relevant current neighborhoods compared.
- Exact premises passes operational design.
- Complete launch cash and reserve funded.
- Conservative break-even has buffer.
- Evidence, pilot, build, and triggers archived.
| Selection factor | Evidence | Decision use |
|---|---|---|
| Audit domain | Pass | Fail response |
| Market | Dated demand/providers/traffic/population | Refresh |
| Premises | Requirements, layout, delivery, security fit | Choose another shell |
| Finance | Full cash and reachable break-even | Resize or reject |
| Operations | Roster, hours, supply, protection valid | Redesign |
| Evidence | Build 3674 worksheet and pilot | Test before scaling |
Research ledger
These links establish mechanics or provide a reproducible lead. Any balance-sensitive number still has to be checked in the current save.
Questions answered
Which neighborhood is universally most profitable?
None is established as universally best. Compare demand, providers, traffic, population, exact premises, rent, staffing, logistics, security, and tested contribution for the chosen business and save.
How many neighborhoods are in version 1.0?
Seven. The official 1.0 release adds The Hamptons. Guides or rankings built around a permanent six-neighborhood map are incomplete for this baseline.
Does a high demand percentage guarantee sales?
No. Developer guidance says demand responds to provider count and low demand does not universally mean zero sales. Traffic, price, promotion, capacity, hours, stock, and operation still matter.
How does traffic reduce marketing need?
A developer approximation is promotion = min(100, traffic index + marketing score/2), so the score needed for 100 is max(0, 2*(100-traffic)). Confirm current UI behavior after patches.
Does traffic matter for office businesses?
Yes. A December 2025 developer reply confirms traffic index still matters even though office customers are served digitally.
Should I always choose the largest available building?
No. Capacity is an upper bound. Choose a target supported by conservative demand and contribution, and include fit-out, inventory, payroll, security, and logistics costs.
How do I evaluate a second branch?
Record pre-entry portfolio contribution and demand, then compare combined post-entry contribution after cannibalization and step overhead. Your own store also adds a provider.
When should I leave a bad location?
Use a prewritten stop rule based on cash reserve, valid loss weeks, reachable break-even, and one justified correction. Exit when complete operation still cannot support conservative contribution.