
Using the 1.0 Pricing Manager
Centralize neighborhood repricing when a large portfolio makes manual updates expensive.
Decision first
Hire one only when several businesses in the same neighborhood create enough repeated price work.
Pricing Manager is a 1.0 headquarters role for reviewing and applying prices across one neighborhood. It scales administration, but it does not replace economic testing.
Confirm 1.0/build 3674.
Complete operating playbook
- ARTICLE LENGTH
- 5,177 words
- DEEP-DIVE SECTIONS
- 16
- RESEARCH LEDGER
- 8
Role scope and build baseline
Pricing Manager is a 1.0 headquarters role for reviewing and applying prices across one neighborhood. It scales administration, but it does not replace economic testing.
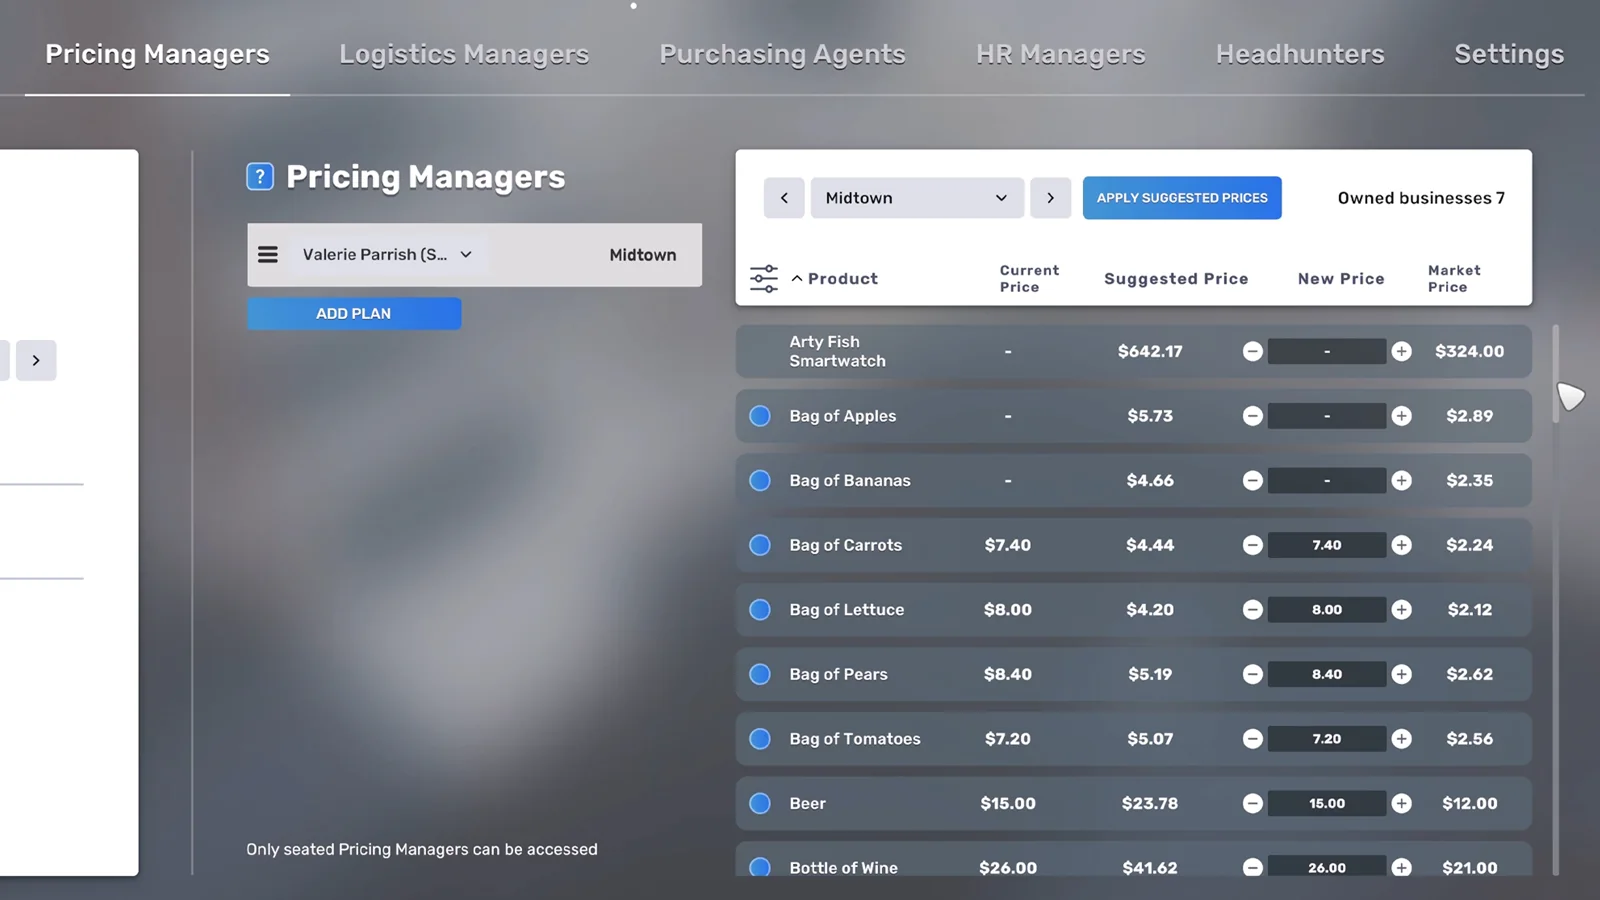
Official release notes say the manager can update the prices of all items throughout an assigned neighborhood. Higher skill produces more accurate daily suggested prices. Scope is therefore broad and suggestion quality is probabilistic.
Developer explanations before release repeat the same design: the role uses the market to suggest prices and can change product prices across the neighborhood. Suggestions are not described as a guaranteed maximum-profit calculation.
Use build 3674 as the baseline. Its hotfix corrected MarketInsider opening to the neighborhood the player is currently in, which matters when a manager’s scope and the market comparison are being recorded.
Do not carry a manager recommendation across neighborhoods. Population mix, providers, traffic, demand, promotion, and existing prices differ. Confirm the neighborhood label before every batch.
Current community reproduction indicates the live F1 help ties skill to suggestion accuracy and shows that low-skill results can be implausible. Use this only as testing evidence; the official claim is directional, not an exact error percentage.
Create a decision ledger before applying the first suggestion. The essential unit is item plus business plus neighborhood plus effective date, even when one manager screen can change many rows at once.
Action checklist
- Confirm 1.0/build 3674.
- Read the live Pricing Manager F1 entry.
- Verify manager neighborhood scope.
- Treat skill as accuracy, not certainty.
- Create an item-level decision ledger.
| Pricing control | Evidence to keep | Decision |
|---|---|---|
| Claim | Evidence status | Operational rule |
| Neighborhood-wide control | Official 1.0 | Check scope before apply |
| Daily suggestions | Official 1.0 | Review each day |
| Higher skill improves accuracy | Official 1.0 | Train before broad reliance |
| Exact optimal price | Not established | Test contribution locally |
Activate the manager correctly
The pricing system is useful only after the employee, headquarters workstation, schedule, and neighborhood assignment form a valid chain.
Hire the exact Pricing Manager job from the current office recruitment channel. Assign the employee to Headquarters, place and validate desk, chair, and computer as required, and schedule work during HQ’s fixed weekday operating window.
Select the neighborhood scope in the current management screen. Read every included business before authorizing changes. A store recently moved or opened may be missing from the expected set until the assignment or day refreshes.
Train the manager if the expected cost of inaccurate broad changes exceeds training expense and delay. Record skill on every suggestion day because improvement changes confidence in the recommendation.
After training, reassignment, or a business-type change, verify the person is again assigned and scheduled. Developer support for HQ roles warns that these transitions can leave employees unassigned.
Build 3674 fixed a quit-related employee state that could stop several scheduled systems. If the manager or other HQ automation behaved nonsensically before the hotfix, update, advance a day, and collect a clean suggestion rather than diagnosing economics from a broken event.
Maintain a manual fallback price sheet. Centralization increases blast radius: one invalid assignment should not erase the last accepted prices or their rationale.
Action checklist
- Hire the correct role.
- Assign to HQ and a valid weekday desk.
- Set and verify neighborhood scope.
- Reaudit after training or transfers.
- Keep last accepted prices outside the suggestion view.
| Pricing control | Evidence to keep | Decision |
|---|---|---|
| Activation link | Evidence | Failure sign |
| Employee | Correct title and skill | No pricing controls |
| Workstation | Valid HQ desk and schedule | No daily output |
| Scope | Named neighborhood | Wrong businesses affected |
| History | Last accepted price ledger | No rollback point |
Define the pricing objective
A manager cannot optimize an objective the player has not chosen. Separate gross contribution, total profit, throughput, and market-entry goals.
For an established item, the usual operational objective is contribution after variable product cost while protecting enough demand to use profitable capacity. For a new store, the short-term objective may be collecting a clean demand response rather than extracting maximum margin immediately.
Define unit contribution m = selling price P minus landed unit cost C. Landed cost should reflect the current source and any direct per-unit cost the player consistently uses. Do not compare prices without their costs.
Define period gross contribution G = quantity Q multiplied by (P minus C). Business profit then subtracts wages, rent, marketing, insurance allocation, security, cleaning, and other period costs. A price can improve G while total profit falls because staffing or promotion changed.
For office services, replace unit quantity with billable services or customers and include direct specialist labor in the hour analysis. A high nominal service price with idle expensive staff is not automatically superior.
Write the objective beside the test: maximize weekly contribution, fill an underused fixed-capacity store, protect stock from selling out before delivery, or establish a defensible launch price. Different goals can justify different short-run decisions.
Never use customer satisfaction color alone as the objective. It is a response signal. A price in an accepted warning range may still maximize contribution, while a fully green price can leave substantial margin unused.
Action checklist
- Choose a stated objective.
- Record landed cost per item.
- Calculate unit and period contribution.
- Separate gross contribution from business profit.
- Use satisfaction as evidence, not the target.
| Pricing control | Evidence to keep | Decision |
|---|---|---|
| Objective | Primary metric | Guardrail |
| Contribution | Q times P minus C | No chronic stockout |
| Total profit | All revenue minus all costs | Comparable operations |
| Utilization | Customers versus active capacity | Positive marginal contribution |
| Market entry | Stable response data | Limited test budget |
Capture a pre-change snapshot
Every manager recommendation needs a before state. Without it, the result cannot be attributed or reversed.
Record business, neighborhood, item, current price, suggested price, visible market or reference price, landed cost, manager skill, and timestamp. Include whether the suggestion is new that day or carried from an earlier review.
Capture MarketInsider demand, provider count, relevant competing offers when visible, traffic index, promotion, customer capacity, staffed capacity, opening hours, and product availability. Build 3674’s correct-neighborhood fix makes the location label especially important.
Record the last seven valid days of units sold, customers, revenue, COGS, price satisfaction, stockout hours, queues, theft, and net result. Mark days contaminated by supply failures, schedule gaps, or capacity changes.
For a chain, keep separate rows for each business even if the manager proposes one neighborhood-wide action. The same item can face different traffic, layout, hours, or stock at each location.
Take the snapshot before accepting the batch. Screens can refresh, and reconstructing the prior state from memory invites confirmation bias. A screenshot is useful, but searchable text values are needed for formulas.
Assign a test ID such as PM-MIDTOWN-SHIRT-03 and write the allowed change. This prevents a later bulk click from being mistaken for the carefully planned experiment.
Action checklist
- Snapshot price, suggestion, cost, skill, and time.
- Capture current neighborhood market controls.
- Collect seven valid pre-change days.
- Keep business-level rows inside a broad scope.
- Assign a unique test ID.
| Pricing control | Evidence to keep | Decision |
|---|---|---|
| Snapshot group | Fields | Why |
| Price | Current, suggested, reference, cost | Margin and rollback |
| Market | Demand, providers, traffic, promotion | Context |
| Operations | Capacity, staff, hours, stock | Confounders |
| Outcome | Units, customers, revenue, COGS, satisfaction | Baseline |
| Control | Build, time, test ID | Reproducibility |
Use the break-even quantity formula
A proposed price increase is economically safe only if retained sales volume preserves enough margin.
Let P1 be current price, P2 proposed price, C landed unit cost, Q1 baseline quantity, and Q2 post-change quantity. Gross contribution improves when (P2 minus C) times Q2 is greater than (P1 minus C) times Q1.
For an increase where both margins are positive, the break-even retention ratio is Q2/Q1 greater than (P1 minus C)/(P2 minus C). This is more useful than asking whether customer count fell, because some volume loss can be profitable.
Example: P1 is 20, C is 8, and P2 is 22. Baseline margin is 12 and proposed margin is 14, so the item must retain more than 12/14, or about 85.7 percent, of comparable quantity to improve gross contribution.
For a price decrease, calculate the quantity growth required in the same equation. If capacity, stock, or traffic prevents that growth, a discount can only surrender margin. Verify there is unused profitable throughput before cutting price.
Use contribution from comparable periods, not one day. If the product stocked out under P1, Q1 is censored and the retention threshold is unreliable. Restore supply and establish a clean baseline.
Add downstream costs where they change. Higher volume may require another cashier, larger security coverage, more deliveries, or overtime-like schedule changes. Treat those as incremental fixed blocks in the test.
Action checklist
- Record P1, P2, C, Q1, and Q2.
- Calculate the retention threshold.
- Reject censored stockout baselines.
- Check capacity for discount-driven volume.
- Add step costs caused by volume.
| Pricing control | Evidence to keep | Decision |
|---|---|---|
| Term | Formula | Meaning |
| Unit margin | P minus C | Contribution before period overhead |
| Baseline contribution | Q1 times P1 minus C | Comparison anchor |
| Test contribution | Q2 times P2 minus C | Observed result |
| Retention threshold | P1 minus C divided by P2 minus C | Minimum Q2/Q1 for increase |
Estimate elasticity from controlled tests
Elasticity describes how quantity responds to price, but it is useful only when other demand drivers stay stable.
Estimate e = percentage change in quantity divided by percentage change in price. Use midpoint percentages for larger changes to reduce dependence on direction. Preserve the sign; normal price response often produces negative elasticity.
Change one item by a small step, commonly two to five percent as a testing policy, not a game constant. Keep promotion, hours, staffing, capacity, layout, and inventory stable. Run the same weekdays.
Compare item quantity rather than total store customers when possible. A customer can switch products, and a manager batch can move several prices. Record basket or category substitution as a limitation.
Elasticity near zero during a capacity ceiling does not prove customers are insensitive. The store may be unable to sell more at the lower price. Likewise, a stockout after a decrease hides the true response.
Use several price points to build a local curve. Do not extrapolate far beyond tested values, especially across satisfaction thresholds or competitor changes. Re-estimate after a material market event.
The purpose is not academic precision. The estimate helps choose whether the next controlled step should be up, down, or stopped, and whether a manager suggestion deserves a narrow pilot.
Action checklist
- Use comparable quantity periods.
- Change price in a controlled small step.
- Hold other demand drivers stable.
- Flag capacity and stock censoring.
- Build a local, versioned curve.
| Pricing control | Evidence to keep | Decision |
|---|---|---|
| Observation | Possible reading | Required check |
| Quantity stable after increase | Low local sensitivity | Not capacity-censored |
| Quantity falls modestly | Increase may still improve contribution | Break-even ratio |
| Quantity collapses | Threshold crossed or market changed | Satisfaction and rivals |
| Decrease adds no quantity | Capacity or weak demand response | Throughput and traffic |
Run a single-item pilot before a batch
Neighborhood-wide controls are efficient, but the first test of an uncertain recommendation should minimize blast radius.
Select one representative business and item when the interface permits manual local pricing. Apply the proposed price or a smaller step, then leave manager-wide prices untouched. Label the effective hour.
Run at least the same weekday span as the baseline. A full week captures weekend differences; multiple weeks are warranted for low-volume products. Do not judge from the first few customers.
Measure units, contribution, customers, satisfaction, stockouts, queue state, and business profit. Compare against the formula’s required retention ratio. If the pilot passes with a buffer, consider broader application.
If a broad manager action cannot be decomposed, export or transcribe every affected current price first, apply the batch, and classify it as a bundle. Analyze high-value or high-volume items individually afterward.
Stop the test early only for a clearly damaging condition such as near-zero demand, severe dissatisfaction, cash crisis, or runaway stockout caused by a decrease. Record the stop rule and partial exposure.
After a pass, roll out in stages across the neighborhood if stores differ materially. A central role permits one click; good control still uses checkpoints.
Action checklist
- Pilot one item or smallest feasible scope.
- Match baseline weekdays.
- Evaluate retention and contribution.
- Transcribe every price before a mandatory bundle.
- Use written stop and rollout rules.
| Pricing control | Evidence to keep | Decision |
|---|---|---|
| Stage | Scope | Gate |
| Pilot | One item/business | Contribution clears buffer |
| Small rollout | Similar stores | No operational confounders |
| Neighborhood rollout | Remaining valid scope | Item-level review scheduled |
| Rollback | Failed or implausible result | Restore recorded prices |
Interpret suggestion quality and manager skill
Manager skill changes confidence, not the owner’s duty to verify the recommendation.
Official wording is qualitative: higher skill suggests the best prices more accurately each day. Do not convert that into a claimed fixed error band unless the live game explicitly displays one.
Current version-labelled community testing reports large misses from lower-skill managers and generally more plausible results near full skill, with unusual edge cases after extreme prices. This supports a training-and-review policy, not a universal accuracy statistic.
Classify recommendations by risk. Low risk means a small step on a low-volume item with clean data; medium risk means a meaningful margin or volume change; high risk means a large jump, high-value item, broad batch, or contradiction with recent tests.
Require stronger evidence for higher risk: a high-skill manager, clean market snapshot, pilot, longer baseline, and explicit rollback. A low-skill suggestion can still be tested narrowly, but should not be applied blindly across a valuable district.
Track suggestion error after each accepted test: suggested price minus the best tested local price, or suggested contribution versus best tested contribution. The latter is more economically meaningful but requires careful comparable periods.
Retrain or replace the manager only after separating skill from bad inputs. Stockouts, monopoly edge cases, capacity ceilings, or stale price anchors can make even a reasonable market suggestion look poor.
Action checklist
- Do not invent a fixed accuracy percentage.
- Risk-rate each suggestion.
- Require stronger evidence for broad changes.
- Track realized suggestion error.
- Separate skill from censored market data.
| Pricing control | Evidence to keep | Decision |
|---|---|---|
| Risk | Example | Approval standard |
| Low | Small step, low-volume SKU | Clean snapshot and short pilot |
| Medium | Core item adjustment | High skill and full-week comparison |
| High | Large jump or district batch | Pilot, rollback, strong buffer |
| Exceptional | Extreme or contradictory suggestion | Hold and reset baseline |
Market color and competitor context
The game’s price indicators are warnings and comparisons, not a complete profit solver.
A developer reply explains that yellow can mean the price is above the lower of market/default reference values, while red indicates a larger deviation. It also notes that a profitable sweet spot can sit in yellow. Treat this as interpretation guidance from an older build and confirm current labels.
Being the neighborhood’s lowest price is possible when the player’s own store sets the floor. Undercutting every visible competitor can therefore create a price race without proving added contribution.
Record provider count and competing changes. A developer explanation of MarketInsider says demand reflects providers and can fall when another seller enters, including another store owned by the player. A price response after entry is not pure elasticity.
Population mix matters. Developer guidance says working-, middle-, and upper-income groups can accept prices differently. The same nominal item may support different tested prices across neighborhoods.
Do not infer a precise optimal markup from district class. Use the class as context for test priority, then validate quantity retention and satisfaction in the actual business.
Maintain a competitor-event flag. When a rival opens, closes, reprices, or when the player adds a branch, restart the baseline before accepting a suggestion trained on the prior state.
Action checklist
- Read colors as signals, not commands.
- Avoid reflexive lowest-price competition.
- Record provider changes.
- Keep neighborhood population context.
- Restart tests after competitor events.
| Pricing control | Evidence to keep | Decision |
|---|---|---|
| Signal | Supported interpretation | Not supported |
| Yellow | Above a reference threshold | Automatically unprofitable |
| Red | Farther from reference | Exact demand loss |
| Lowest price | May be player-controlled floor | Best strategy |
| District class | Different acceptance tendency | Fixed markup |
Capacity, stock, and price interaction
Pricing cannot be evaluated separately from the store’s ability to serve and supply customers.
If customers equal a known capacity ceiling, a price decrease cannot reveal full demand because throughput is capped. Consider a price increase, capacity expansion, or no change based on contribution, but mark the test as capacity-constrained.
If an item stocks out, observed quantity is the minimum of demand and supply. A higher price that prevents the stockout may improve service timing and contribution, but first distinguish intentional rationing from a broken logistics target.
Calculate price-adjusted stock cover using the new observed daily rate. A successful discount may require higher store targets, more warehouse stock, more vehicle capacity, or shorter replenishment intervals. Include those costs.
Queues create another censor. A lower price can attract customers that abandon or remain unserved, while wages for added lanes jump in blocks. Measure staffed throughput and complaints with quantity.
For multi-product stores, a change to one item can affect basket composition and shared checkout load. Keep item and whole-store contribution views. A losing item may be a valid traffic driver only if the cross-item effect is measured, not assumed.
Never accept a manager batch immediately before a known supply gap. Stabilize inventory across the measurement window so the price result reflects willingness to buy.
Action checklist
- Flag every capacity ceiling.
- Invalidate stockout-censored quantity.
- Recalculate targets after volume changes.
- Include checkout step costs.
- Measure item and store-wide contribution.
| Pricing control | Evidence to keep | Decision |
|---|---|---|
| Constraint | Observed bias | Correction |
| Product stockout | Quantity too low | Restore supply and rerun |
| Building/fixture cap | Demand response hidden | Raise price or capacity test |
| Checkout queue | Realized sales suppressed | Staffed-throughput test |
| Delivery limit | Discount cannot be sustained | Cost supply expansion |
Office and service pricing
Service businesses use the same contribution logic, but labor capacity and idle specialist wages dominate the test.
Record service price, clients by hour, staffed valid workstations, specialist wage, opening hours, traffic, promotion, demand, and satisfaction. A neighborhood Pricing Manager may cover the service price, but the test unit remains business and staffed hour.
Estimate seat-hour contribution = service revenue attributable to the hour minus direct specialist wage minus incremental support allocation. Break-even utilization = wage plus allocation divided by revenue per occupied service slot, adjusted to the live service cadence.
A price decrease is useful only if additional clients can occupy idle valid seats and their contribution exceeds added costs. If the business already fills staffed seats, discounting gives away margin unless it changes another measured outcome.
A price increase can tolerate client loss according to the same margin-retention equation, but labor schedules create step costs. If one fewer client does not let a worker shift be removed, the immediate labor cost stays fixed.
Run weekday-hour comparisons because office demand and traffic vary. Do not extrapolate a law-firm result to Web Development, Graphic Design, Travel Agency, or Event Planning; current office types have different wages, demand, and service economics.
After changing price, resize schedules only in a second experiment. Simultaneous price and staffing changes make it impossible to know whether client movement came from acceptance or service capacity.
Action checklist
- Record clients and staffed seats by hour.
- Calculate seat-hour contribution.
- Check unused capacity before discounting.
- Respect labor step costs.
- Separate price and schedule experiments.
| Pricing control | Evidence to keep | Decision |
|---|---|---|
| Service metric | Formula/use | Warning |
| Utilization | Clients divided by staffed valid seats | Building cap is not demand |
| Seat contribution | Revenue minus direct wage and allocation | Idle payroll can dominate |
| Retention | Post/pre clients versus margin threshold | Use comparable hours |
| Schedule step | Whole worker shift added or removed | Not a smooth unit cost |
Monopoly and extreme-price edge cases
Market-based suggestions can become unreliable when the visible market is distorted by the player’s own extreme price or by very few providers.
Current 1.0 community reproduction reports an edge case where a near-zero manual price appeared to influence a manager recommendation. Treat this as versioned testing, not confirmed internal code, and reproduce it before generalizing.
When the player is the only or dominant provider, market reference can become thin. Do not assume the absence of competitors means unlimited pricing power. Customer acceptance, district mix, demand, and capacity still constrain outcomes.
If a suggestion is many test steps away from the last profitable range, do not jump directly. Restore the last accepted price, wait for a clean daily refresh, then approach the candidate through controlled increments.
Keep an anchor independent of the manager: tested price range, cost, quantity, contribution, satisfaction, and market state. This prevents circular logic in which the manager recommends from a distorted price and the result becomes the new justification.
Use a sanity check: proposed price must have positive margin, plausible retention threshold, adequate stock, and no contradiction with recent local tests. Failure of any check sends it to manual review.
Report reproducible anomalies with build, save state, neighborhood, item, manager skill, current price, suggestion, market screen, and next-day result. Avoid presenting one edge case as a universal exploit.
Action checklist
- Treat extreme-price reports as testable anomalies.
- Maintain an independent accepted-price anchor.
- Move through increments, not giant jumps.
- Apply a four-part sanity check.
- Document reproducible edge cases.
| Pricing control | Evidence to keep | Decision |
|---|---|---|
| Edge condition | Risk | Control |
| Near-zero current price | Suggestion anchor distortion | Reset and refresh |
| Single provider | Thin market reference | Use local demand test |
| Large proposed jump | Severe volume loss | Incremental ladder |
| Conflicting recent evidence | Bad input or transient state | Hold and rebaseline |
Portfolio rollout across a neighborhood
Neighborhood-wide control becomes valuable when the portfolio is segmented and changes are staged, not when every suggestion is accepted at once.
Group items by contribution, volume, shortage risk, and evidence quality. Review high-contribution and high-risk rows first. Low-volume items need longer samples; required products need stock protection.
Rank proposed changes by expected contribution impact = baseline quantity times margin change plus expected quantity response times new margin, with uncertainty stated. Use a range if elasticity is not known.
Apply the smallest coherent batch. For example, change one product family across similar stores while leaving unrelated services untouched. Record every included business and item because scope errors are easy in a broad neighborhood.
Set portfolio stop rules: total daily contribution drop, severe satisfaction fall, multiple stockouts, or an implausible manager refresh. A batch should have one rollback file of prior prices and a named reviewer date.
Compare aggregate and item-level results. Aggregate profit can rise while a strategically important SKU collapses, or one high-volume item can hide several bad changes. Preserve both views.
After rollout, update inventory targets and staffing only when measured volume requires it. Sequence changes so price evidence remains interpretable.
Action checklist
- Segment items by impact and risk.
- Estimate impact with uncertainty.
- Apply a small coherent batch.
- Define portfolio stop and rollback rules.
- Review aggregate and item results.
| Pricing control | Evidence to keep | Decision |
|---|---|---|
| Segment | Review cadence | Rollout |
| High contribution | Daily during test | Pilot first |
| High shortage risk | Before any decrease | Supply gate |
| Low volume | Longer matched period | Small step |
| Stable low risk | Weekly | Later batch |
Troubleshooting decision tree
When profit worsens after a manager action, locate whether the cause is price, market, capacity, stock, operation, or scope.
First verify the exact applied prices and affected neighborhood. If the scope or value differs from the ledger, restore recorded prices and reapply only after the manager chain is corrected.
Second ask whether stock, capacity, queues, staffing, hours, or security changed. If yes, the result is confounded. Repair operation and rerun the price test; do not estimate elasticity from censored sales.
Third compare MarketInsider demand, provider count, district, traffic, and promotion with the baseline. Build 3674 fixes correct-neighborhood opening, but the player must still record the displayed location.
Fourth compute contribution and retention. If quantity fell more than the break-even threshold after a clean increase, roll back or test a smaller step. If quantity retained enough but total profit fell, inspect period costs.
Fifth examine manager skill and suggestion plausibility. Hold an extreme recommendation, reset the accepted anchor, and wait for a clean daily suggestion. Reproduce before reporting a bug.
If every control matches but the result differs, extend the sample. Low volume and weekday variation can produce large percentage swings from a few customers.
Action checklist
- Verify applied value and neighborhood.
- Remove operational confounders.
- Check market changes.
- Compute retention and period cost.
- Hold implausible suggestions and extend noisy samples.
| Pricing control | Evidence to keep | Decision |
|---|---|---|
| Node | Pass | Fail |
| Scope/value correct? | Check operation | Restore and repair |
| Operation stable? | Check market | Repair and rerun |
| Market comparable? | Compute economics | Start new baseline |
| Contribution passes? | Keep or widen rollout | Rollback or smaller step |
| Suggestion plausible? | Continue review | Hold and refresh |
Pricing decision record
The permanent output of pricing work is a dated, reversible decision record tied to the exact market state.
Use one row per item, business, and test. Store neighborhood, manager, skill, current price, suggestion, applied price, unit cost, baseline quantity, test quantity, baseline and test contribution, satisfaction, and date.
Add market context: demand, providers, competing reference, traffic, promotion, opening hours, and district population notes. Add operations: building and product capacity, staffed stations, queues, stockouts, theft, and delivery coverage.
Store formulas explicitly. Retention threshold, observed retention, percent price change, percent quantity change, elasticity estimate, and contribution delta should be reproducible from raw values.
Mark evidence quality as valid, censored by stock, capped by capacity, altered by competition, or too small a sample. Do not delete failed tests; they define the unsafe side of the local curve.
Write the decision in words: accept, reject, narrow pilot, rollback, or await more data. Include the next review trigger, such as a provider change, cost change, patch, new branch, or persistent capacity ceiling.
Keep prior accepted prices in a rollback table. Centralized convenience is safe only when recovery does not depend on memory.
Action checklist
- One row per item and business.
- Capture market and operational context.
- Preserve raw formula inputs.
- Grade evidence quality.
- Keep rollback and review trigger.
| Pricing control | Evidence to keep | Decision |
|---|---|---|
| Record group | Fields | Output |
| Identity | Build, date, test, neighborhood, business, item | Traceability |
| Economics | P1, P2, C, Q1, Q2, contribution | Decision |
| Context | Demand, providers, traffic, promotion | Comparability |
| Constraints | Stock, capacity, queues, staff | Validity |
| Governance | Manager skill, decision, rollback, trigger | Control |
Final audit
Before declaring neighborhood prices managed, verify activation, evidence quality, economics, operations, and reversibility.
Confirm the Pricing Manager is assigned to Headquarters, scheduled at a valid weekday desk, trained to the chosen confidence level, and attached to the intended neighborhood. Review included businesses before a broad action.
Confirm every accepted price has a pre-change snapshot, landed cost, clean baseline, explicit objective, retention threshold, matched post-change period, and contribution result. Flag rather than hide censored tests.
Confirm no accepted result depended on a stockout, unstaffed station, capacity ceiling, queue failure, major promotion change, or unrecorded competitor event. If unavoidable, label the conclusion provisional.
Confirm broad batches were piloted or risk-rated, prior prices are recoverable, and item-level outcomes were reviewed alongside aggregate profit. Update inventory and staffing only after the price test closes.
Confirm MarketInsider displays the intended neighborhood under build 3674 and that source dates, build, manager skill, and test IDs are archived. Future patches can change behavior; live F1 and reproducible data then supersede this guide.
Set recurring reviews for material landed-cost changes, new providers, own-store expansion, district moves, sustained satisfaction changes, chronic stockouts, major capacity changes, manager replacement, or relevant patch notes.
Perform a final counterfactual check for each high-impact change. Ask what the same quantity would have earned at the old margin, what the old quantity would have earned at the new margin, and how much of the observed result came from quantity response rather than the mechanical margin change. Then compare those figures with actual contribution and period overhead. This decomposition exposes a recommendation that looks successful only because an unrelated busy week increased traffic. Store the calculation beside the decision so the next reviewer can distinguish price effect, volume effect, and external market movement. Require a second reviewer pass for every neighborhood-wide batch affecting a core product. Preserve rejected suggestions too; they document unsafe ranges and prevent the same unproductive experiment from being repeated after a staff change.
Action checklist
- Manager chain and scope pass.
- Every price has clean before/after economics.
- No hidden operational confounders.
- Rollback and item-level review exist.
- Build, evidence, and review triggers archived.
| Pricing control | Evidence to keep | Decision |
|---|---|---|
| Audit | Pass evidence | Failure response |
| Activation | HQ, desk, schedule, neighborhood | Repair manager |
| Economics | Retention and contribution clear buffer | Rollback/test smaller |
| Validity | Comparable unconstrained periods | Rerun |
| Portfolio | Risk-rated, reversible, item-reviewed | Narrow scope |
| Version | Build 3674 and current F1 | Relabel or retest |
Research ledger
These links establish mechanics or provide a reproducible lead. Any balance-sensitive number still has to be checked in the current save.
Questions answered
Does the Pricing Manager automatically maximize profit?
No. Official wording says higher skill improves the accuracy of daily suggestions. Validate each suggestion with landed cost, quantity retention, contribution, satisfaction, capacity, stock, and comparable periods.
What area can one Pricing Manager change?
Official 1.0 notes and developer explanations describe neighborhood-wide control. Confirm the assigned neighborhood and included businesses in the current UI before applying.
What is the break-even volume after a price increase?
With old price P1, new price P2, and unit cost C, gross contribution improves when Q2/Q1 is greater than (P1-C)/(P2-C), assuming positive margins and comparable unconstrained periods.
Should I always stay in the green satisfaction range?
No. An older developer explanation says a profitable range can be yellow and that colors compare with reference thresholds. Measure contribution and retention; confirm current 1.0 label behavior in F1.
Why did a price cut not add customers?
Capacity, staffed throughput, traffic, demand, promotion, or stock may cap realized sales. A discount cannot reveal more demand when the business cannot serve or supply it.
Can a low-skill manager be used?
Yes, but treat suggestions as higher-risk hypotheses. Use small pilots, clean snapshots, explicit rollback, and longer validation; train before broad valuable changes.
How should I handle an extreme suggestion?
Hold it, verify neighborhood and skill, restore the last accepted price if the current price is extreme, wait for a clean daily refresh, and approach any candidate through controlled increments.
When must prices be retested?
After material cost, competitor, own-store, district, demand, promotion, hours, capacity, inventory, manager, or patch changes. A tested price is local and versioned, not permanent.