
Retail inventory targets that prevent stockouts
Convert seven-day sales into store targets with coverage and fixture capacity.
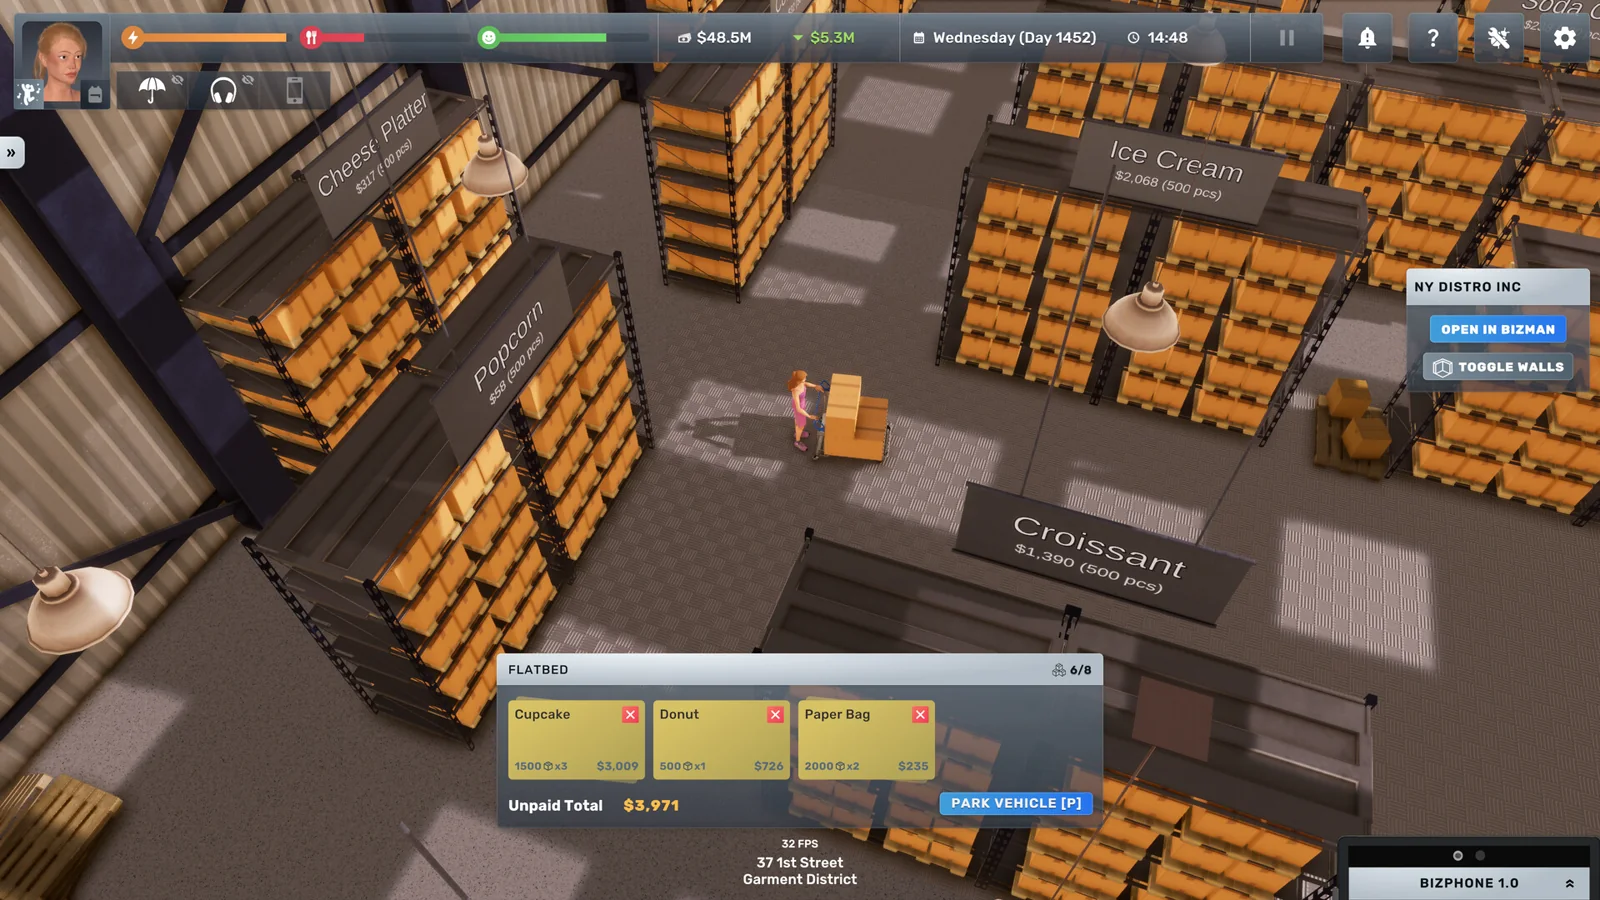
Decision first
Set each store target to the greater of combined fixture capacity or daily demand multiplied by coverage days.
This guide treats retail inventory as a measured flow of units through build 3674, while retaining older official mechanics only where current F1 and 1.0 behavior still confirm them.
Confirm 1.0/build 3674.
Complete operating playbook
- ARTICLE LENGTH
- 5,189 words
- DEEP-DIVE SECTIONS
- 15
- RESEARCH LEDGER
- 8
Version baseline and inventory evidence hierarchy
This guide treats retail inventory as a measured flow of units through build 3674, while retaining older official mechanics only where current F1 and 1.0 behavior still confirm them.
Official EA 0.9 supply-chain notes changed wholesaler and importer orders from boxes to individual units, removed the old minimum order, displayed sold and ordered totals for the previous week, and introduced Smart Delivery. These are foundational mechanics, but every current screen label should be read in 1.0 before applying an old example.
The 1.0 release added clearer customer-capacity and placement information, more even distribution of stock among eligible store fixtures, importer box-size visibility, reorderable delivery lists, and use of Storage Shelves in warehouses and factories. Those changes directly affect how targets and storage are audited.
Build 3674 fixed employee-quit states that could cause deliveries, imports, training, and other scheduled systems to fail. After updating an affected save, advance to the next day and discard the broken day from service-level calculations. A failed automation day is not evidence that the target formula is wrong.
Developer replies clarify that logistics targets are expressed in individual units and refer to total stock at the destination, including goods already on displays and in store storage. Automated delivery tops the destination toward the target, constrained by source inventory, destination space, route configuration, and timing.
Use community guides only when they identify a game version and expose inputs. Reject tables that prescribe one target for every store, because product velocity, box size, lead time, display capacity, opening hours, district demand, and safety tolerance differ.
Action checklist
- Confirm 1.0/build 3674.
- Read F1 and current product labels.
- Treat orders and targets as units.
- Discard days with the fixed automation fault.
- Record the version of every external test.
| Control | What to record | Decision use |
|---|---|---|
| Source | Reliable use | Caveat |
| Official 1.0 notes | Current interface and distribution changes | Not a demand forecast |
| Official EA 0.9 notes | Unit ordering and Smart Delivery design | Recheck current labels |
| Developer reply | Meaning and timing of targets | Examples may use older capacities |
| Versioned test | Reproduce a specific scenario | Do not universalize |
Map the end-to-end stock flow
Inventory control begins by drawing where each unit comes from, where it waits, and when it becomes available for sale.
For a manual startup, the chain may be wholesaler to vehicle to delivery spot to store storage to display to sale. A scaled chain is importer or factory to warehouse, then logistics vehicle to store, then reserve storage and display. Record every handoff because each has a different failure mode.
Name the source, order cadence, arrival time, warehouse, Logistics Manager, vehicle, route priority, destination target, store shelf space, product fixtures, and sale. If a product has two sources, document which one is primary and when manual emergency purchases are allowed.
Inventory in a store is a combined position. A logistics target is not merely back-room stock, and display units already count toward it. This explains why a delivery can be smaller than the empty storage shelf appears to permit: the system sees units across the destination.
Physical boxes still matter even though plans use units. Convert units to boxes for vehicle and storage planning using the current units-per-box value. Rounding up is mandatory because a partial requirement still consumes a package or storage slot in practical planning.
Draw timing on the map. A Monday 08:00 import cannot replenish a route that already ran at 02:00 that Monday. Either carry enough buffer through the earlier run, change the operational pattern where supported, or expect the next route cycle.
Action checklist
- List every source and destination.
- Record unit targets and box conversion separately.
- Include displays in destination stock.
- Map manager, vehicle, and route ownership.
- Put scheduled times on the flow diagram.
| Control | What to record | Decision use |
|---|---|---|
| Stage | Record | Typical failure |
| Supplier/importer | Price, cadence, limit, arrival | Order absent or late |
| Warehouse | Units, boxes, shelf space | No source stock or overflow |
| Logistics | Manager, vehicle, destinations, order | Missed or deprioritized route |
| Store reserve | Free shelf slots and total units | No destination capacity |
| Display/sale | Assigned fixtures and daily velocity | Stockout despite reserve |
Build a SKU ledger from management screens
Manage each product as a separate flow. Store averages hide the exact item that limits sales or fills storage.
For every SKU, record current price, landed unit cost, units sold last week, units ordered last week, current warehouse units, current total store units, combined display capacity, store target, units per box, supplier, and confirmed inbound order.
Add operational fields: average daily units sold, maximum observed daily use, delivery interval, importer lead timing, safety days, stockout hours, low-inventory alerts, and lost-capacity warnings. Mark promotions, price changes, opening-hour changes, and new fixtures that alter demand or required stock.
Take readings at consistent times. A warehouse snapshot just before a route and one just after answer different questions. Label every entry with game day and hour so receipts, transfers, and sales can be reconciled rather than mixed.
Separate measured fields from calculated fields. The UI supplies sold-last-week and on-hand values; the guide’s forecast and safety stock are player calculations. Preserve the raw values so a bad assumption can be corrected without losing evidence.
Use a notes column for anomalies: employee quit, vehicle unavailable, destination full, importer limit reached, competitor event, player manual transfer, or patch update. Exclude or adjust abnormal periods when computing normal velocity.
Action checklist
- Create one row per SKU and destination.
- Capture current UI values at a fixed time.
- Label measured and calculated columns.
- Annotate every manual transfer or disruption.
- Retain raw weekly history.
| Control | What to record | Decision use |
|---|---|---|
| Field group | Minimum entries | Purpose |
| Commercial | Price, cost, sold, ordered | Demand and margin |
| Position | Warehouse, store, display, inbound | Availability |
| Packaging | Units per box and shelf slots | Space conversion |
| Timing | Order, arrival, route, lead interval | Reorder design |
| Exceptions | Fault, stockout, manual action | Clean analysis |
Forecast demand without pretending it is constant
A practical forecast starts from recent sales and then checks whether those sales were constrained or changed by the business itself.
Baseline average daily use d as valid units sold over valid open days. Do not divide by seven when the shop was closed two days unless the target must cover calendar days between deliveries. Keep an open-day rate and a calendar-day depletion rate when schedules are irregular.
Sales during a stockout understate demand. Flag any day where the product or a required fixture hit zero, customer capacity was limited, checkout queues were severe, or the business was incomplete. Replace the raw average only with a transparent estimate, such as the median of comparable in-stock weekdays.
Segment by weekday for strongly shaped businesses. A weekend peak should not be diluted into a smooth daily average if the route must survive it. Forecast the exact interval from one delivery to the next by summing expected weekday demand.
After price, promotion, hours, district, or capacity changes, begin a new regime. Do not average old and new rates indefinitely. Retain the old series for comparison, but size the next cycle from the most relevant valid observations.
Scenario: a gift shop sold 420 units last week but was empty for Saturday afternoon. The naïve daily average is 60. If comparable stocked Saturdays normally sell 110, the next forecast should restore that missing interval before adding safety; otherwise the target will recreate the shortage.
Action checklist
- Compute open-day and calendar depletion rates.
- Exclude or estimate constrained periods explicitly.
- Forecast the actual weekday interval.
- Restart the baseline after material changes.
- Document every imputed stockout value.
| Control | What to record | Decision use |
|---|---|---|
| Condition | Forecast treatment | Reason |
| Fully stocked stable week | Use recent valid average or weekday profile | Observed sales represent service |
| Stockout | Estimate lost interval separately | Sales are censored |
| Price/promotion change | Start new regime | Demand response changed |
| New fixture/hours | Collect fresh comparable days | Capacity or exposure changed |
Set store targets from display, lead time, and safety
A logistics target must be high enough to fill all displays and carry sales until the next dependable replenishment.
Use target_p = max(combined display capacity_p, forecast demand over replenishment interval_p plus safety stock_p). This formulation prevents a target lower than the product’s installed display capacity while also covering fast sellers whose lead-time demand exceeds the display sum.
Combined display capacity means all eligible fixtures assigned to the SKU. A developer example explains that two displays with a combined requirement above a low target can leave one underfilled and trigger recurring warnings. Read the current fixture values rather than copying the example’s old number.
Safety stock can begin as average daily use multiplied by chosen safety days. A more responsive method uses recent maximum deviation during the lead interval. The correct buffer depends on acceptable stockout risk, storage cost, supplier reliability, and box size; it is not one universal percentage.
The automated delivery request is conceptually max(0, target minus total destination stock), then constrained by warehouse source units, destination capacity, and the route. The system does not need the player to calculate boxes for the target, but the player needs box conversion to ensure shelves and vehicles can hold the plan.
Round operational quantities consciously. If target units translate to 6.2 boxes, plan space for seven. If adding the seventh box crowds out a higher-margin SKU, shorten the replenishment interval or reduce safety after evidence, rather than silently accepting an impossible target.
Action checklist
- Sum every display assigned to the SKU.
- Forecast to the next dependable delivery.
- Add a documented safety rule.
- Set the target in units.
- Verify rounded box space at source and destination.
| Control | What to record | Decision use |
|---|---|---|
| Variable | Definition | Source |
| D | Combined display capacity in units | Current fixture labels |
| L | Forecast demand through delivery interval | Valid sales ledger |
| S | Chosen safety stock | Risk policy and variability |
| Target | Maximum of D and L plus S | Player calculation |
| Delivery need | Maximum of zero and target minus total store stock | Logistics behavior |
Design safety stock by service risk
Safety stock is insurance against variability and failure, so it should be larger where a shortage is expensive and recovery is slow.
Classify SKUs by margin contribution, sales velocity, replacement lead time, box bulk, supplier constraints, and whether the product is required for customer capacity. A low-margin bulky slow seller should not receive the same buffer as a fast required category.
Start with safety days: S = average daily use times safety days. Choose more days when imports are weekly, route timing crosses a weekend peak, supplier limits bind, or stockouts disable a required category. Choose fewer when local wholesale rescue is quick and storage is expensive.
After several valid cycles, calculate observed errors: actual interval demand minus forecast interval demand. A practical buffer can cover a chosen high recent error rather than the single worst event forever. Record the method and sample window so the number can be audited.
Keep emergency stock visible in the ledger. If it is quietly consumed every week, it is not safety stock; the base forecast or route cadence is too low. Replenish it after an exceptional event and investigate the cause.
Scenario: paper bags are cheap but operationally critical and shared among registers under 1.0 distribution. Their margin is indirect, yet running out can disrupt checkout. Give support items a risk class based on business interruption rather than their sale price.
Action checklist
- Classify every SKU by shortage consequence.
- Choose and document safety days.
- Review forecast errors after each cycle.
- Distinguish recurring demand from emergencies.
- Treat critical support goods separately.
| Control | What to record | Decision use |
|---|---|---|
| Risk class | Buffer tendency | Review signal |
| Required fast seller | Higher | Any stockout hour |
| Imported weekly item | Higher around cadence gap | Monday timing failure |
| Local slow seller | Lower | Excess weeks of cover |
| Bulky low-margin item | Minimal practical | Storage crowding |
| Critical support good | Based on interruption risk | Checkout or service warning |
Order planning for wholesalers and importers
Purchasing should replace expected consumption and rebuild safety without ordering stock already on hand or confirmed inbound.
For a weekly manual or importer plan, use order units = forecast demand until the next receipt plus desired ending safety stock minus usable on-hand units minus confirmed inbound units. Clamp at zero. Add any deliberate growth stock as a named separate term.
EA 0.9 removed minimum orders and moved plans to units, but suppliers still have weekly limits and imports still follow their scheduled cycle. Check each current supplier screen for availability and limits before assuming the formula can be fulfilled.
For importers, complete contracts, assign the Purchasing Agent and plan, verify the deadline, and ensure warehouse capacity. A developer reply identifies Sunday 20:00 as the practical cutoff for the Monday import plan in the referenced system. Confirm the live schedule in F1 before relying on it after future patches.
Convert the order to boxes with ceiling(order units divided by units per box) to check pallet or shelf space. The 1.0 importer interface shows box size, which makes this calculation auditable. Leave room for existing inventory and other products arriving together.
Do not double-order after a delayed screen refresh. Record confirmed inbound separately from desired order, advance through the actual arrival event, then reconcile. If an import failed during the quit-related bug state, update to 3674, advance a day, and rerun from a clean plan.
Action checklist
- Calculate net order after on-hand and inbound.
- Check current weekly supplier limits.
- Assign the correct Purchasing Agent and plan before cutoff.
- Convert units to boxes for space.
- Reconcile receipts before issuing a replacement order.
| Control | What to record | Decision use |
|---|---|---|
| Order term | Formula role | Mistake prevented |
| Interval forecast | Base replacement need | Ordering only last week blindly |
| Ending safety | Protection after receipt | Arriving exactly at zero |
| Usable on hand | Subtract | Duplicate stock |
| Confirmed inbound | Subtract | Double order |
| Growth stock | Explicit addition | Hiding optimism in safety |
Warehouse and logistics target execution
A correct store target still fails if the warehouse, manager, vehicle, destination list, or storage capacity is wrong.
Assign one Logistics Manager to the source warehouse under the documented model, give the route a valid vehicle, add destinations, and set per-product unit targets. The manager’s skill and vehicle govern how many destinations can be served; read the current F1 values rather than using an old fixed number.
At the scheduled logistics event, the route attempts to top each destination toward target. Developer replies describe automated vehicle delivery as not having a player-entered quantity cap; practical limits remain source inventory, destination storage, configuration, and timing.
Order destinations deliberately. The 1.0 release allows delivery lists to be reordered. Put stores with required fast sellers, low remaining cover, or high shortage cost ahead when source or time is constrained. Record the priority rule so one favorite shop does not silently starve the rest.
Maintain warehouse forward cover: warehouse target = sum of destination demand until the next inbound receipt plus warehouse safety minus inventory expected to remain at destinations where it cannot serve another store. Do not merely sum every store target; targets include local stock already present.
Scenario: a warehouse has 1,000 units, two stores target 600 each, and the first receives enough to consume the source. The second shortage is not a destination formula error. Increase inbound stock, adjust priorities, split routes, or reduce impossible service promises.
Action checklist
- Verify manager, vehicle, destinations, and unit targets.
- Read live skill and destination limits.
- Prioritize routes by shortage consequence.
- Forecast warehouse need from future transfers.
- Check source stock before blaming destination logic.
| Control | What to record | Decision use |
|---|---|---|
| Route control | What to record | Diagnostic |
| Manager | Assignment, skill, schedule/status | No eligible route |
| Vehicle | Type, capacity/status, source | Route cannot execute |
| Destination order | Priority position | One store repeatedly starved |
| Target | Units per SKU per store | Wrong refill amount |
| Source cover | Units through next inbound | System-wide shortage |
Monday timing and other cadence traps
Inventory failures cluster around event timing. A plan that balances weekly totals can still stock out between two scheduled events.
A documented pattern is logistics at 02:00 and imports at Monday 08:00. If the warehouse enters Monday nearly empty, the early route cannot use stock that arrives six hours later. The Monday stores may wait until the next delivery cycle unless manually rescued.
Prevent the gap by carrying warehouse stock sufficient for the pre-import route, increasing destination cover before the weekend, or arranging the route cadence supported by the current game. Record actual event times from the live UI because future patches may change them.
Cutoff timing matters too. A plan assigned after the Purchasing Agent’s deadline may look correct but miss the current cycle. Keep a Sunday preflight that verifies agent assignment, importer plan, quantities, supplier limits, cash, and warehouse space before the documented cutoff.
Store opening hours can create another gap. A 24-hour shop may consume stock after the final evening observation and before a route. Take readings at a consistent pre-route time and size cover across overnight sales.
Scenario: weekly demand and weekly imports are both 700 units, yet stores stock out Monday morning. The totals balance; the sequence does not. Add a timing buffer equal to expected consumption between the 02:00 route and the first route able to use Monday’s receipt.
Action checklist
- Write every scheduled event on a weekly timeline.
- Carry stock through pre-receipt deliveries.
- Run a pre-cutoff purchasing audit.
- Include overnight consumption.
- Solve timing gaps, not just weekly totals.
| Control | What to record | Decision use |
|---|---|---|
| Event | Risk | Control |
| Sunday plan cutoff | Correct plan misses cycle | Preflight before deadline |
| Monday 02:00 logistics | Warehouse not yet replenished | Carry source buffer |
| Monday 08:00 import | Receipt too late for early route | Plan next usable transfer |
| Overnight sales | Unseen depletion | Use consistent snapshot time |
Store-level refill behavior and fixtures
Reserve stock and displays form one system. Understand their relationship before manually moving boxes or raising every target.
Developer replies state that store displays refill from store storage when the display reaches zero under the documented behavior. This can make a display look temporarily empty before refill, and it means reserve stock must be accessible and correctly associated with the product.
Under 1.0, inventory is distributed more evenly among eligible fixtures. For example, support stock such as paper bags can be spread across multiple registers. Inspect the total across fixtures rather than diagnosing one low stack in isolation.
Set the target above combined display capacity when lead-time demand requires reserve. A target equal only to one fixture’s stock may repeatedly leave another underfilled. Check the business capacity status because an empty required category can reduce more than that SKU’s sales.
Do not place warehouse pallet shelves in a retail back room merely because they look larger. Current developer guidance distinguishes store Storage Shelves; the 1.0 change additionally permits those shelves in warehouses and factories. Use current valid furniture descriptions.
When manually restocking during diagnosis, record the transfer. Otherwise the automated route appears to have delivered more than it did and the forecast understates true need. Manual rescue is useful, but invisible rescue ruins the ledger.
Action checklist
- Inspect total product stock across all fixtures.
- Provide reserve beyond combined display when needed.
- Use current valid storage furniture.
- Record every manual restock.
- Recheck capacity after any empty required category.
| Control | What to record | Decision use |
|---|---|---|
| Symptom | Likely mechanism | Check |
| One fixture low | Distribution or pending zero-trigger refill | Total SKU stock |
| All fixtures low | Target, source, or demand problem | Route and forecast |
| Reserve present, display empty | Association, access, or refill timing | Fixture validity and reproduction |
| Persistent capacity warning | Combined target below display need | Raise and retest |
Inventory economics and working capital
More stock improves service only until carrying cash and space costs outweigh the reduction in shortages.
Calculate days of cover = usable on-hand units divided by average calendar-day use. Report it by location and network-wide. A high warehouse cover with empty stores signals transfer failure; high cover everywhere signals overbuying or demand decline.
Estimate inventory turn = units sold during the period divided by average total units held. Compare the SKU with its own history, not a universal benchmark across products with different box sizes, margins, and delivery cycles.
Track cash tied in stock = units on hand times landed unit cost. Add confirmed inbound commitments. This amount competes with wages, rent, marketing, expansion, and loan service; a large safety buffer can make a profitable income statement feel cash-poor.
Measure stockout cost as missed contribution where defensible, not missed revenue. If lost demand cannot be observed directly, log stockout hours and compare comparable in-stock days. State the uncertainty instead of inventing exact lost customers.
Use a two-sided review: reduce targets for persistent excess cover and increase them for repeated valid shortages. Make one SKU change at a time where possible, then observe at least a full replenishment cycle.
Action checklist
- Calculate days of cover by location.
- Track turns against the SKU’s own history.
- Value cash tied in stock and inbound.
- Estimate shortage loss from contribution.
- Change targets after complete cycles.
| Control | What to record | Decision use |
|---|---|---|
| Metric | Formula | Use |
| Days of cover | Usable units divided by daily use | Find shortage or excess |
| Turn | Period sales divided by average stock | Compare policy over time |
| Cash tied | Units times landed unit cost | Protect liquidity |
| Stockout loss | Estimated missed units times unit contribution | Value service failure |
Shrink and reconciliation
A stock discrepancy may be theft, unrecorded transfer, timing, or counting error. Reconcile before raising purchase plans.
Use expected closing units = opening units plus receipts plus inbound transfers minus outbound transfers minus recorded sales. Observed shrink is expected closing minus actual closing when positive. Apply the equation to one SKU and one clearly timed period.
Read theft expense in the store’s EconoView and align it with the same period. Theft is valued by the game’s financial reporting; do not assume every missing unit equals retail price. Keep a separate note for opportunity contribution if stolen stock caused a shortage.
Check manual vehicle loads, returns, destination changes, factory transfers, and fixtures before labeling a discrepancy theft. Inventory may be physically elsewhere in the network. Use timestamped snapshots around logistics events.
If security changes, compare repeated equivalent periods. Avoided theft = baseline theft loss minus secured theft loss. Net security benefit = avoided theft minus incremental guard and equipment cost, with uncertain avoided stockout contribution noted separately.
Persistent unexplained imbalance after a clean build-3674 reproduction deserves an F2 report. Include save time, business, SKU, opening and closing counts, scheduled events, manual actions, and screenshots of EconoView and inventory screens.
Action checklist
- Reconcile one SKU over a defined period.
- Compare with store-specific theft expense.
- Audit manual and automated transfers.
- Measure security changes on equivalent periods.
- Report reproducible unexplained imbalances.
| Control | What to record | Decision use |
|---|---|---|
| Term | Equation role | Evidence |
| Opening | Starting observed units | Timestamped inventory |
| Receipts/transfers in | Add | Supplier and route events |
| Sales/transfers out | Subtract | BizMan and logistics |
| Expected closing | Calculated balance | Ledger |
| Shrink | Expected minus observed | Compare EconoView theft |
Troubleshooting decision tree
Diagnose shortages from the store backward through target, space, route, source, purchase, and timing.
First ask whether the destination total is below target. If no, the target is too low for combined displays or demand. Recalculate display sum, lead-time forecast, and safety. If yes, continue upstream.
Second ask whether the store has free valid storage and display capacity. If full, reduce incompatible stock, add valid shelves, adjust box planning, or shorten deliveries. If space exists, inspect the route.
Third verify Logistics Manager assignment, vehicle status, destination inclusion, list priority, SKU target, and scheduled execution. Check build 3674 and advance a day if the old employee-quit failure affected automation.
Fourth inspect warehouse source units at the route time, not after the import. If empty, check Purchasing Agent plan, cutoff, supplier limit, cash, box space, and import arrival. Solve the Monday 02:00 versus 08:00 gap explicitly.
Finally, if stock is available but not selling, inspect fixture validity, product assignment, capacity warnings, opening staff, price, and demand. Inventory availability is necessary, not sufficient for sales.
Action checklist
- Below target? Recalculate or continue.
- Destination space free? Fix if not.
- Route configured and executed? Repair.
- Source stocked at event time? Repair purchasing/timing.
- Stock present but no sales? Check operation and market.
| Control | What to record | Decision use |
|---|---|---|
| Decision | Yes | No |
| Destination below target? | Check space and route | Raise justified target |
| Space available? | Check route | Add or free valid storage |
| Route executed? | Check source at event | Repair manager/vehicle/list |
| Source had units? | Check destination recognition | Repair purchasing/cadence |
| Product available to customers? | Check market | Fix fixtures/staff |
Cycle count and change control
Regular inventory reviews catch drift before a visible stockout and prevent several simultaneous target edits from obscuring the cause.
Run a quick daily exception review for red or low-stock alerts, failed deliveries, source shortages, and critical support goods. Run a complete weekly review after the import and logistics cycle has settled, using the same game time each week.
Count A-class required or high-contribution SKUs most often, B-class stable sellers weekly, and C-class bulky slow items less frequently but whenever storage pressure appears. The classes are operational priorities, not universal profit rankings.
When changing a target, log old value, new value, reason, forecast window, safety rule, expected box change, and effective route. Do not alter price, promotion, opening hours, and target simultaneously unless an emergency demands it; label any bundle.
Compare outcomes after one complete replenishment interval: stockout hours, ending cover, emergency purchases, route fill, warehouse cover, cash tied, and contribution. Roll back a target increase that only creates persistent excess without improving service.
Keep a build marker. After a patch affecting logistics, fixtures, distribution, vehicles, managers, or suppliers, run a controlled cycle before trusting historical thresholds. Preserve the old policy as a comparison, not as current truth.
Action checklist
- Review exceptions daily and full ledger weekly.
- Count critical SKUs more often.
- Log every target change and box impact.
- Evaluate after a complete cycle.
- Rebaseline after relevant patches.
| Control | What to record | Decision use |
|---|---|---|
| Review | Fields | Action threshold |
| Daily exception | Alerts, route failures, critical cover | Repair before next opening |
| Weekly cycle | Sales, receipts, ending cover, cash | Tune one SKU |
| Post-change | Old/new target and outcome | Keep or roll back |
| Post-patch | Build and controlled reproduction | Replace stale rule |
Final inventory audit
The final audit verifies that every product can survive its timing, fit in physical space, and be explained by the management ledger.
Confirm each SKU has a current supplier, unit cost, units-per-box value, valid source, store target, combined display capacity, forecast interval, safety rule, and destination shelf plan. No number should be inherited without a date and build.
Confirm Purchasing Agents, importer plans, deadlines, weekly limits, cash, and warehouse receiving space. Then confirm Logistics Managers, vehicles, destinations, priorities, targets, and source cover at the actual route time.
Verify the Monday and overnight timing gaps, all required product categories, support stock, and every store’s next delivery. Simulate the worst normal weekday sequence, not only average weekly totals.
Reconcile one full cycle using opening plus receipts and transfers minus sales and outbound transfers. Explain any difference with theft, manual action, rounding, or a reproducible fault. Ensure store EconoView and inventory timestamps refer to the same period.
Archive the final target table, box-space calculation, event timeline, exception log, build 3674, and review triggers. Triggers include repeated stockout, excess cover, price or hours change, new fixture, new store, supplier limit, route change, manager change, or relevant patch.
Before closing the audit, perform one dry-run forecast for the next cycle. Begin with the actual closing position, add only confirmed inbound receipts and planned transfers, subtract the weekday-specific forecast, and calculate projected units and rounded boxes at every event boundary. Any negative position predicts a stockout; any position above physical capacity predicts blocked receipts. Resolve the earliest failure first and store the revised calculation with the plan.
Action checklist
- Every SKU has a dated unit target and box plan.
- Purchasing and logistics assignments pass.
- Cadence gaps are explicitly buffered.
- A full cycle reconciles.
- Policy and review triggers are archived.
| Control | What to record | Decision use |
|---|---|---|
| Audit block | Pass evidence | Failure response |
| SKU policy | Forecast, display, safety, target | Recalculate |
| Physical space | Rounded boxes fit at both ends | Add space or shorten cadence |
| Automation | Managers, plans, vehicles, lists valid | Repair and rerun |
| Reconciliation | Difference explained | Investigate shrink or fault |
| Versioning | Build and dates stored | Retest stale values |
Research ledger
These links establish mechanics or provide a reproducible lead. Any balance-sensitive number still has to be checked in the current save.
Questions answered
Are logistics targets boxes or individual units?
Individual units. Official EA 0.9 notes changed ordering to units, and developer explanations describe destination targets in units. Use units-per-box only to plan vehicle and storage space.
Does the target count only the store’s back room?
No. Developer replies describe total destination stock, including units on displays and in store storage. A top-up is based on the difference between target and that combined position.
Why does one of two displays stay underfilled?
The combined display capacity may exceed the target or total available stock. Sum every eligible fixture for the SKU, raise the target when justified, verify source supply and destination space, then repeat the route.
Why did Monday’s delivery miss stock that arrived Monday?
A documented cadence has logistics at 02:00 and imports at 08:00. The early route cannot use later receipts. Carry a source buffer or plan for the next route; confirm current F1 times after patches.
How much safety stock should I keep?
There is no universal percentage. Start with average daily use times chosen safety days, then adjust from observed forecast error, lead time, supplier reliability, shortage consequence, box size, and available cash.
Do displays refill automatically?
Developer replies describe displays refilling from store storage when they reach zero. Current 1.0 distribution is more even across eligible fixtures. Persistent failures still require checking stock, assignment, access, and target.
How do I distinguish theft from a transfer mistake?
Reconcile opening plus receipts and inbound transfers minus sales and outbound transfers against closing units, then compare the same period with the store’s EconoView theft expense and audit every manual movement.
What should I do after updating to build 3674?
If the save experienced the employee-quit bug that stopped deliveries or imports, advance to the next day, verify assignments, and discard the affected day from normal forecasts before running a clean replenishment cycle.